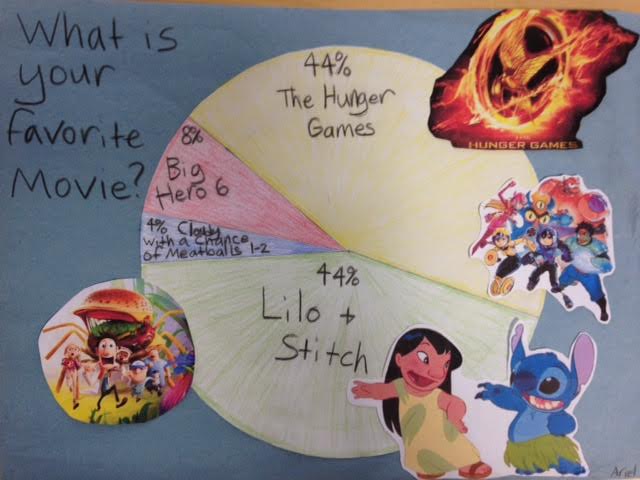
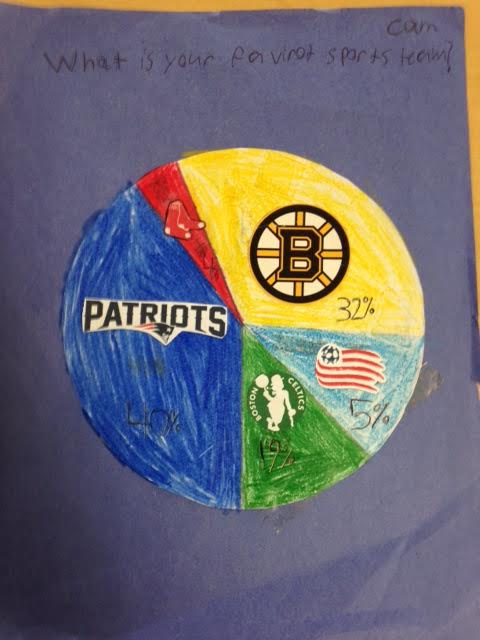
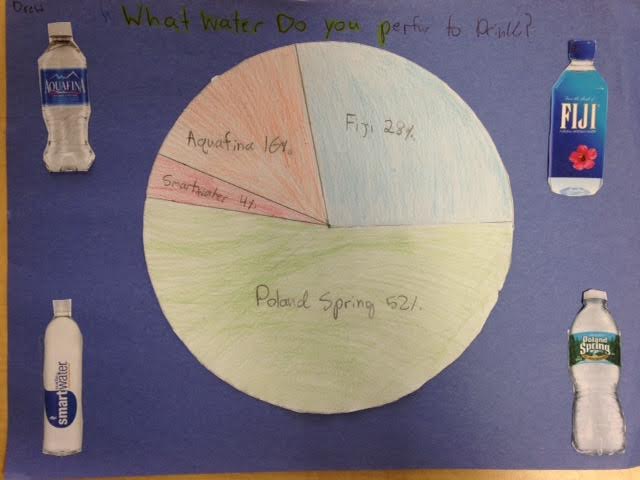
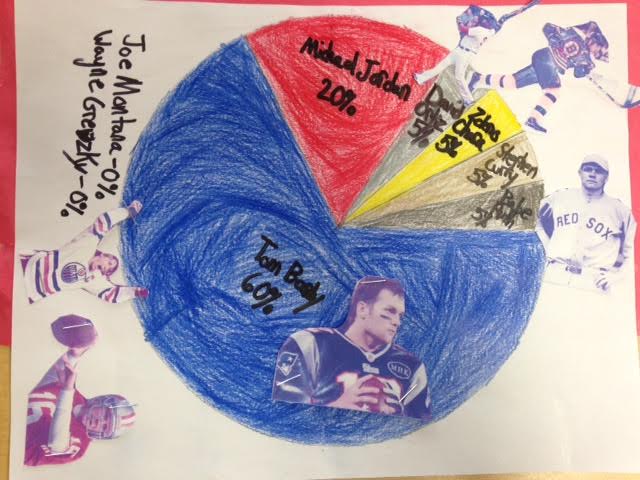
Students have been combining their knowledge of circles and angles with their understanding of percents to create circle graphs. First, students collected data from students in the upper school to answer a survey question they had selected. Using what they have previously learned about percents, students then determined what percent of the students they surveyed selected each choice. Combining this understanding of percents with their knowledge that a circle has a total of 360 degrees, students then determined what angle measure would be that percent of 360 degrees to determine how big the sections in their circle graphs would need to be. Next, students practiced making circles with compasses and measuring angles in them with protractors. Finally, students were ready to put together all that they had done and create a final copy of their graph. Here are their graphs:
|
|
Archives
May 2015
Categories |
 RSS Feed
