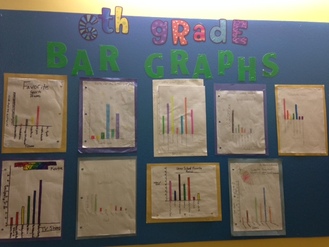
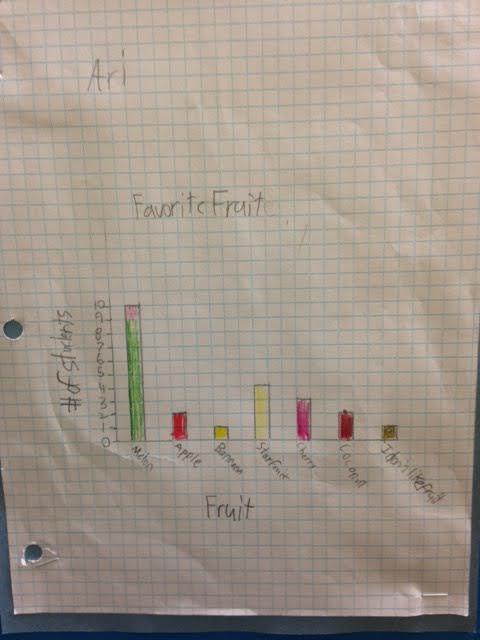
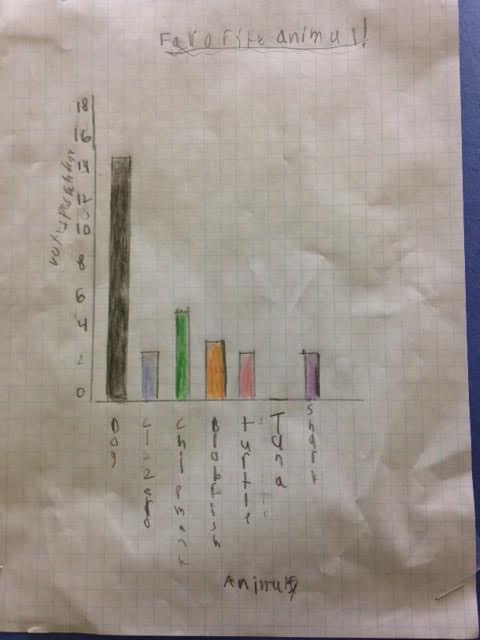
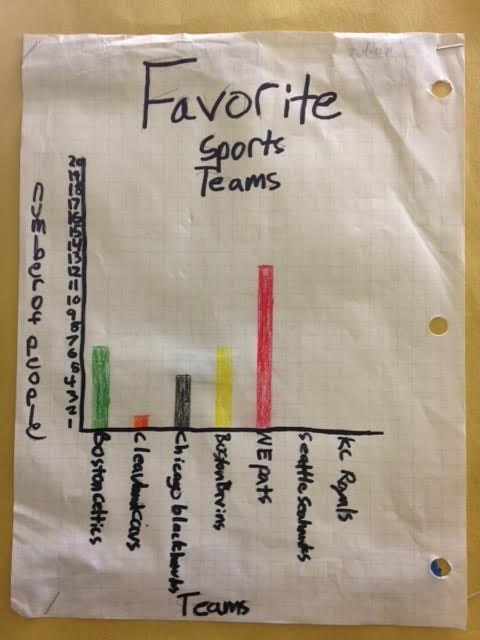
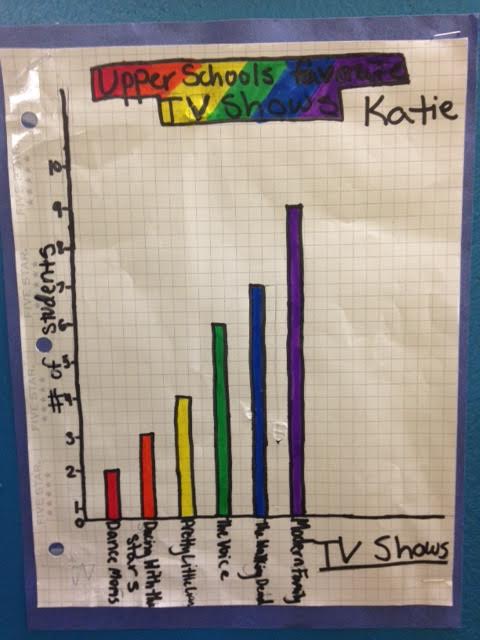
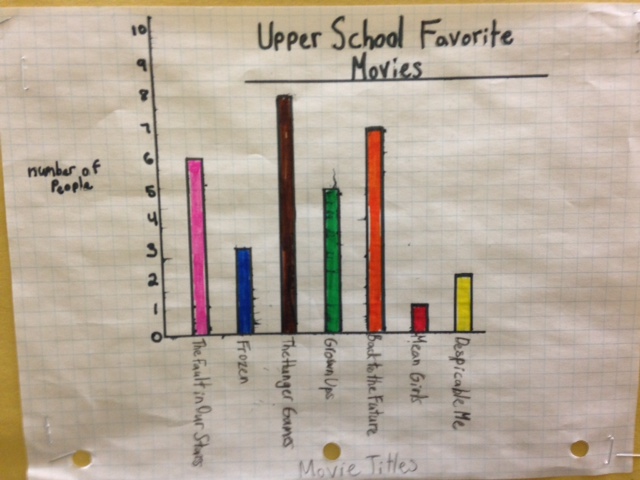
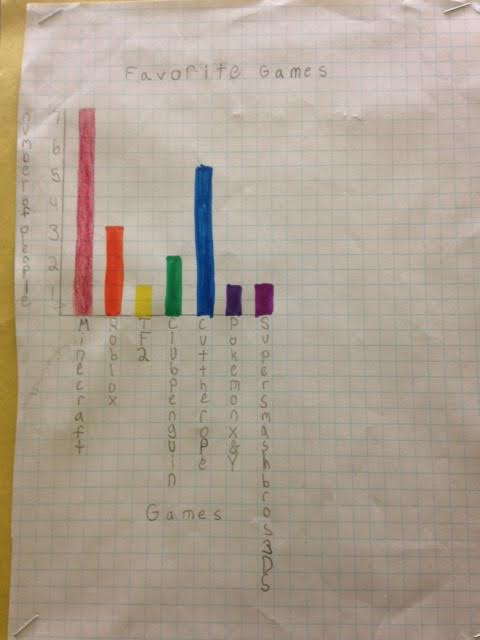
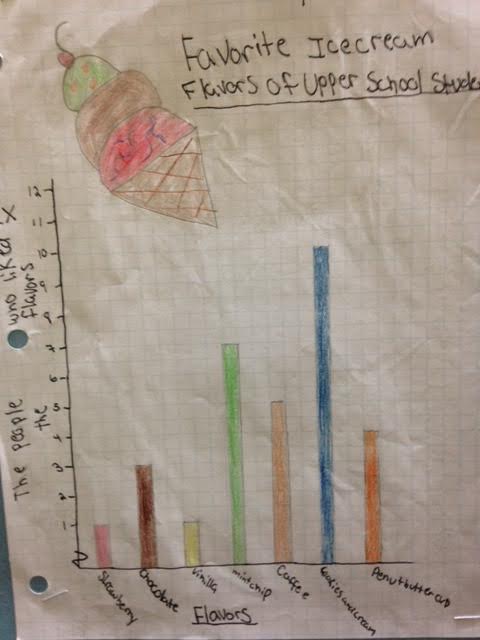
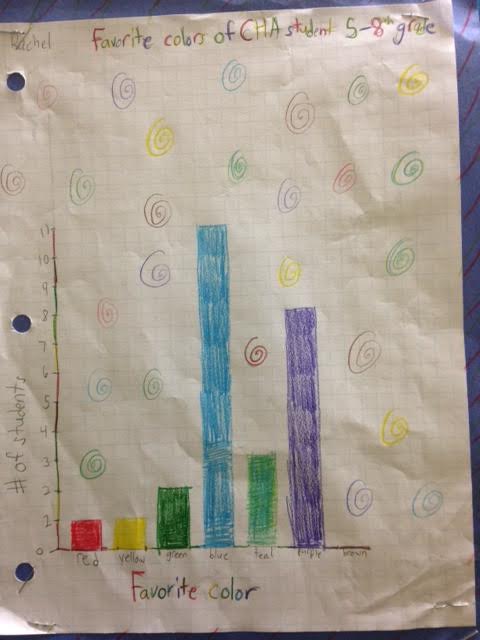
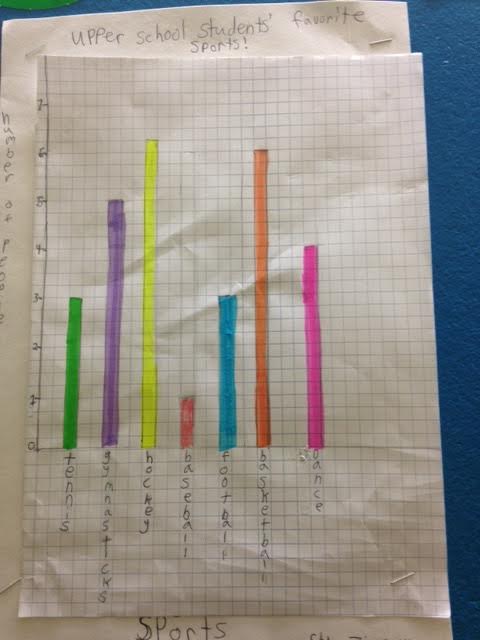
Students have been learning about different ways to analyze and display data. We started by discussing how to find each type of average, as well as when each is most commonly used. Students saw how including an outlier in a set of data can affect the mean and not the median. Next, students learned about ways of displaying data. They have learned how to make bar graphs, line graphs, stem-and-leaf plots, box-and-whisker plots, and histograms. As part of this data analysis unit, students worked on a data collecting project. They surveyed students in the upper school to find out their preferences from a list of choices. After collecting the data, students used what they had learned in class to display the information in a bar graph. Here are the finished products.
 RSS Feed
